When you have created your diagram by adding objects to the project, there are a number of ways in which you can customize it.
You can:
- move objects
- hide objects
- change object display colors
- display qualified names throughout SQL Dependency Tracker
- display column names in the diagram
- show constraints as objects in the diagram and object lists
- show filegroups and system object dependencies
- show relative importance bars
- change the layout of the diagram
- reapply the layout to the diagram
Moving objects
To move an object on the diagram, click the object and drag it to the required position. Note that you must remember to save your changes when you have moved objects on the diagram; you will not be prompted to save the changes when you close the project or open a different project.
If you want to undo your changes and revert to the original layout, click ![]() Reapply Layout.
Reapply Layout.
Showing and hiding objects
You may want to temporarily exclude an object from the diagram. You do this by hiding it. Hiding an object does not remove it from the project, so you can easily show it again.
To hide the selected objects:
- on the toolbar, click
 Hide
Hide - in the diagram, right-click a selected object and click
 Hide
Hide
To hide objects that are not selected, in the Objects in Project pane, clear the ![]() visibility check box for the objects that you want to hide.
visibility check box for the objects that you want to hide.
To reveal all hidden objects:
- on the toolbar, click
 Show Hidden
 - in the diagram, right-click an object and click
 Show Hidden
To reveal individual hidden objects, in the Objects in Project pane, select the ![]() visibility check box for the objects that you want to reveal.
visibility check box for the objects that you want to reveal.
Changing object display colors
To change the display color of an object:
- Select the objects that you want to change.
- Right-click a selected object, and click Properties.
- On the Object Properties dialog box, click the Fill Color or Text Color box, and use the Color selector to specify the color you require.
- Click OK on the Color selector.
If you have changed a color, you can revert to the default color by clicking the relevant Reset button.
- Click Close.
Qualifying names of objects
You can choose to display qualified names for objects and databases:

- On the View menu, click Qualify Names.
- Click Object Names or Database Names as required.
To switch this feature off, select the option again.
Showing table column names
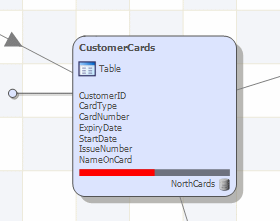
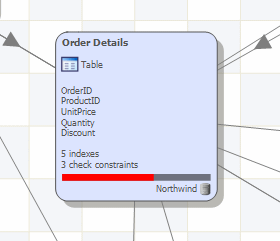
You can show the names of columns in the table objects on the diagram:
- On the toolbar, click
 Table Column Names.
For example:

If ![]() Show constraints as objects is switched off, the number of check constraints and the number of indexes are also shown.
Show constraints as objects is switched off, the number of check constraints and the number of indexes are also shown.

Showing constraints as objects
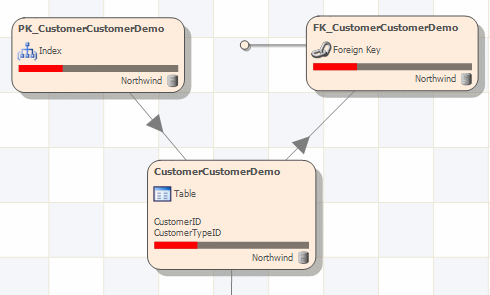
By default, constraints are not represented individually on the diagram. You can show constraints as separate objects in the diagram:
- On the toolbar, click
 Constraints as Objects.

Show filegroups and system object dependencies
By default, filegroup and system object dependencies are not shown in the diagram; these dependencies can make the diagram appear to be very complex, often with many dependencies on one object. However, if required, you can display these dependencies on the diagram.
- On the toolbar, click
 Filegroup and System Object Dependencies.
Show relative importance bars
Relative importance bars are displayed on the objects to indicate how many other objects use the object. The relative importance takes into account dependencies at all levels.
- On the View menu, click
 Relative Importance Bars.
| See Also |
Analyzing the Diagram | Navigating the Diagram | Selecting Objects | Resolving External References | Updating the Project | Tips
© Red Gate Software Ltd 2007. All Rights Reserved.