This worked example gives you a guided tour of the performance profiling features of ANTS Profiler. It introduces you to the program’s main features and shows you how you can use ANTS Profiler to profile your own applications. This worked example is based on a demonstration .NET desktop application that draws a fractal called the Mandelbrot set.
You can run the Mandelbrot Set program by double-clicking the executable file located by default in the following folders:
- For C# :
Program Files\Red Gate\ANTS Profiler 3\Tutorials\CS\Mandelbrot
- For Visual Basic:
Program Files\Red Gate\ANTS Profiler 3\Tutorials\VB\MandelbrotVB
Note that this example refers to the C# version of the program; if you are using Visual Basic, you can follow the example, but you may see slightly different results.
Click Draw Mandelbrot Set to plot the Mandelbrot set:
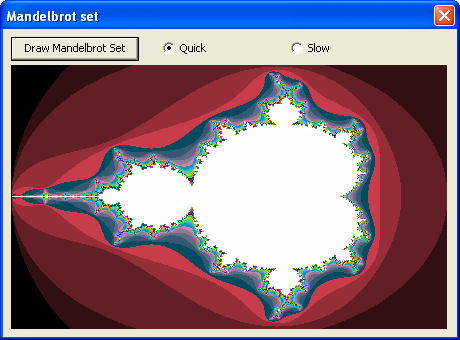
The application uses two alternative methods of calculating the image which you can select by using Quick and Slow. This worked example shows how you can use ANTS Profiler to identify the most time critical parts of the application and determine why one approach is more efficient than the other.
Setting up the profiler
If you have not yet started ANTS Profiler, select it from your Start menu; if it is already running, click ![]() Project wizard.
Project wizard.
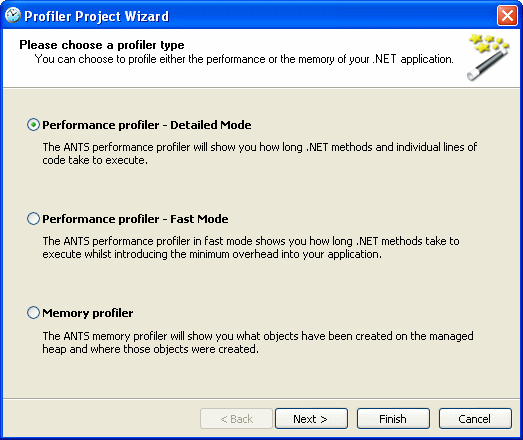
Select Performance profiler - Detailed Mode to investigate how long each line of code takes to execute. Performance profiler - Fast Mode is a feature of the Pro edition that enables you to profile your code much more quickly; fast mode records only how long each method takes to execute.
Click Next to select the type of application.
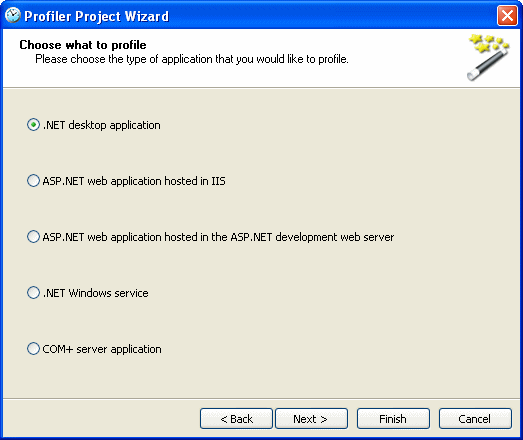
Select .NET desktop application because the Mandelbrot program is a desktop application. Click Next to specify the executable file.
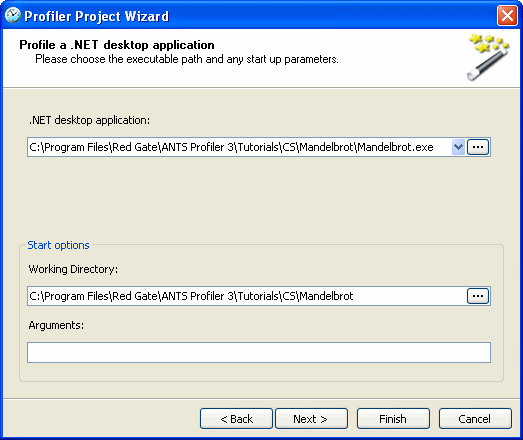
Under .NET desktop application, click ![]() to browse for the folder where the executable file is located. Locate the file Mandelbrot.exe in the folder where you installed ANTS Profiler, for example, Program Files\Red Gate\ANTS Profiler 3\Tutorials\CS\Mandelbrot.
to browse for the folder where the executable file is located. Locate the file Mandelbrot.exe in the folder where you installed ANTS Profiler, for example, Program Files\Red Gate\ANTS Profiler 3\Tutorials\CS\Mandelbrot.
Working Directory is the directory the application is launched from and is set to the location of the executable file; you can select a different working directory, if required. Arguments enables you to specify command line arguments for applications that require them; for this example, leave the box empty.
Click Next to specify the methods to profile.
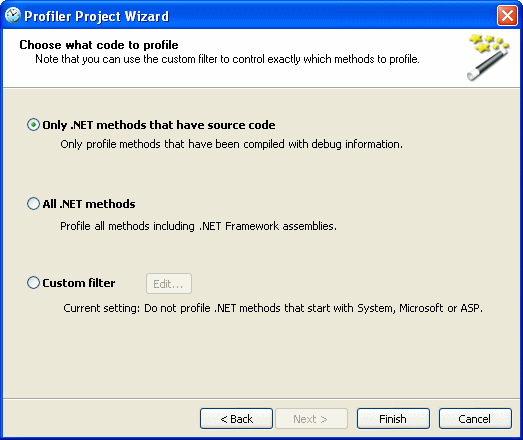
Select Only .NET methods that have source code. The Mandelbrot program provided for this worked example is a debug build with source code; to profile methods with source code, the .pdb file must be located in the same folder as the executable file.
Click Finish.
Profiling the application
When you have finished setting up the profiler, a message dialog box is displayed. Click Yes to run the Mandelbrot program and start profiling.
In the Mandelbrot set window, select Slow to choose the slow algorithm, then click Draw Mandelbrot Set to draw the image.
Note that execution of the application is slower than usual due to the overhead of recording the profiling data. ANTS Profiler takes this into account so that the results represent the usual execution times.
When the image has been drawn, click the close button to exit the Mandelbrot program; this automatically stops the profiler and takes a snapshot.
Viewing the results
ANTS Profiler generates the profiling results and displays a summary in the main window.
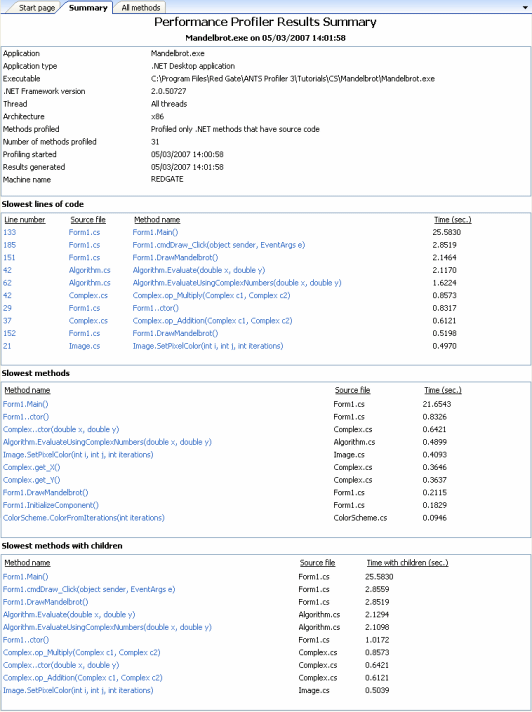
The Summary panel shows basic information about the Mandelbrot program, including:
- the 10 slowest lines of code
- the 10 slowest methods, excluding the time spent executing child methods
- the 10 slowest methods, including the time spent executing child methods
You can click a link in the Summary panel to display the source code for a line or method in the Source code panel. For example, in the Slowest lines of code list, click the Algorithm.Evaluate method to display the source code:
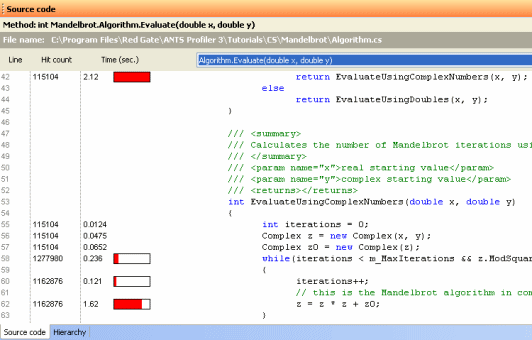
The red bars indicate the slowest lines of code in the Algorithm.Evaluate method; the longer the bar, the slower the line of code. You can see that nearly all the time is spent in the method EvaluateUsingComplexNumbers.
You can display the source code for the EvaluateUsingComplexNumbers method by selecting it from the list at the top of the Source code panel:
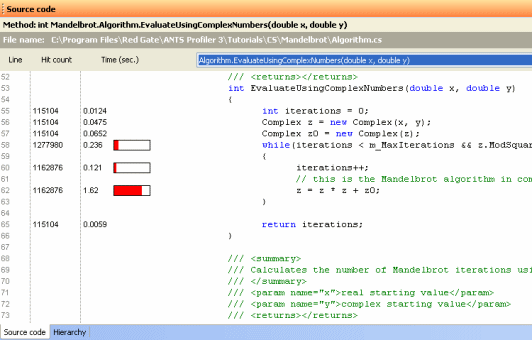
To see a method that is not listed in the Summary panel, you can click the All methods tab to see all the methods in the application.
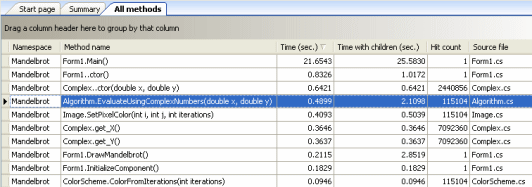
You can sort, filter or group the methods as required. For full details of how to use the All methods panel, see All methods Panel.
To see details of parent or child methods, click the Hierarchy tab. Parent methods are methods that call the current method; child methods are methods that are called by the current method.
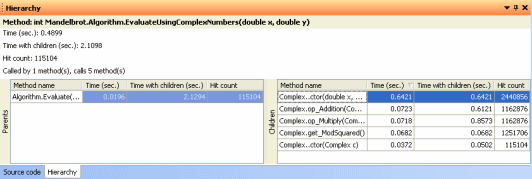
When you click a method in the All methods panel, ANTS Profiler refreshes the hierarchy details. For example, click the method Form1.DrawMandelbrot to find out more about its performance.
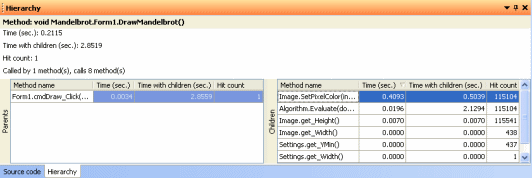
You can see that the Hit count is 1, so it was executed once. Time with children (sec.) is much greater than Time (sec.), so most of the time is spent executing child methods rather than Form1.DrawMandelbrot.
In the list of Children, you can see that most of the time is spent executing methods called by Algorithm.Evaluate and that the method is executed 115104 times, once for each of the pixels in the image.
You can click the parent or child methods to investigate exactly where time is spent in those methods. Click Algorithm.Evaluate to make this the current method. In the list of Children, you can see that Algorithm.Evaluate calls Algorithm.EvaluateUsingComplexNumbers. If you click Algorithm.EvaluateUsingComplexNumbers, you can see that it calls five complex number methods.
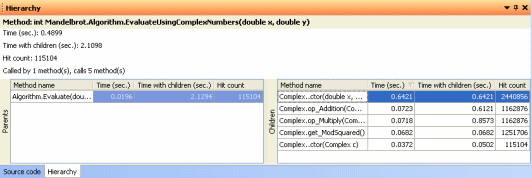
Now that you know that most of the time is spent in the complex number methods, you should consider whether the application will run more efficiently if these methods are written using doubles instead of complex numbers.
You can simulate this using the Mandelbrot program. Click ![]() Start profiling to run the program again. With the Quick option selected, run the Mandelbrot program as before, and then close it.
Start profiling to run the program again. With the Quick option selected, run the Mandelbrot program as before, and then close it.
ANTS Profiler generates a new set of profiling results.
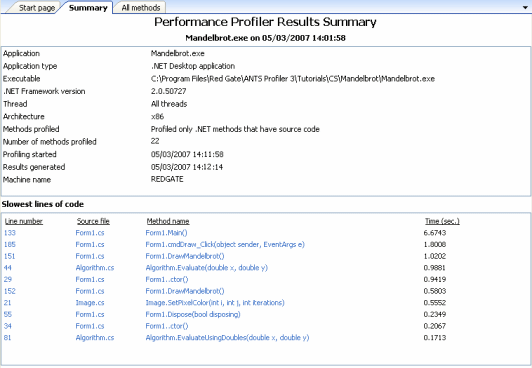
You can see that the Algorithm.Evaluate method executes much more quickly now. If you want to verify this, you can display the first set of results again. To do this, move your mouse pointer over the Results tab, and double-click the first results set.
© Red Gate Software Ltd 2007. All Rights Reserved.